Visualize Users' Access
Key Manager can visualize where individual users have access to. This can be useful for ensuring that a user doesn't have more access than they should via transitive trusts.
Before you can obtain graphs, you will need to enable the visualization feature:
-
On all Key Manager Servers, enable visualization in
/etc/sshmgr/app/localsettings.pyby setting:ENABLE_TRANSITIVE_TRUST = True`Save your changes to the file, then restart all Key Manager services to apply your changes.
-
On Front Ends:
# supervisorctl restart frontend:# supervisorctl restart graphupdate# supervisorctl restart redis -
On Back Ends:
# supervisorctl restart backend:# supervisorctl restart redis
-
-
Wait for the global graph-analysis job to complete at least once since the restarts.
To graph a user's access within the managed environment, go to User Keys→Users, click the a user, then in their details panel, click Show trust graph.
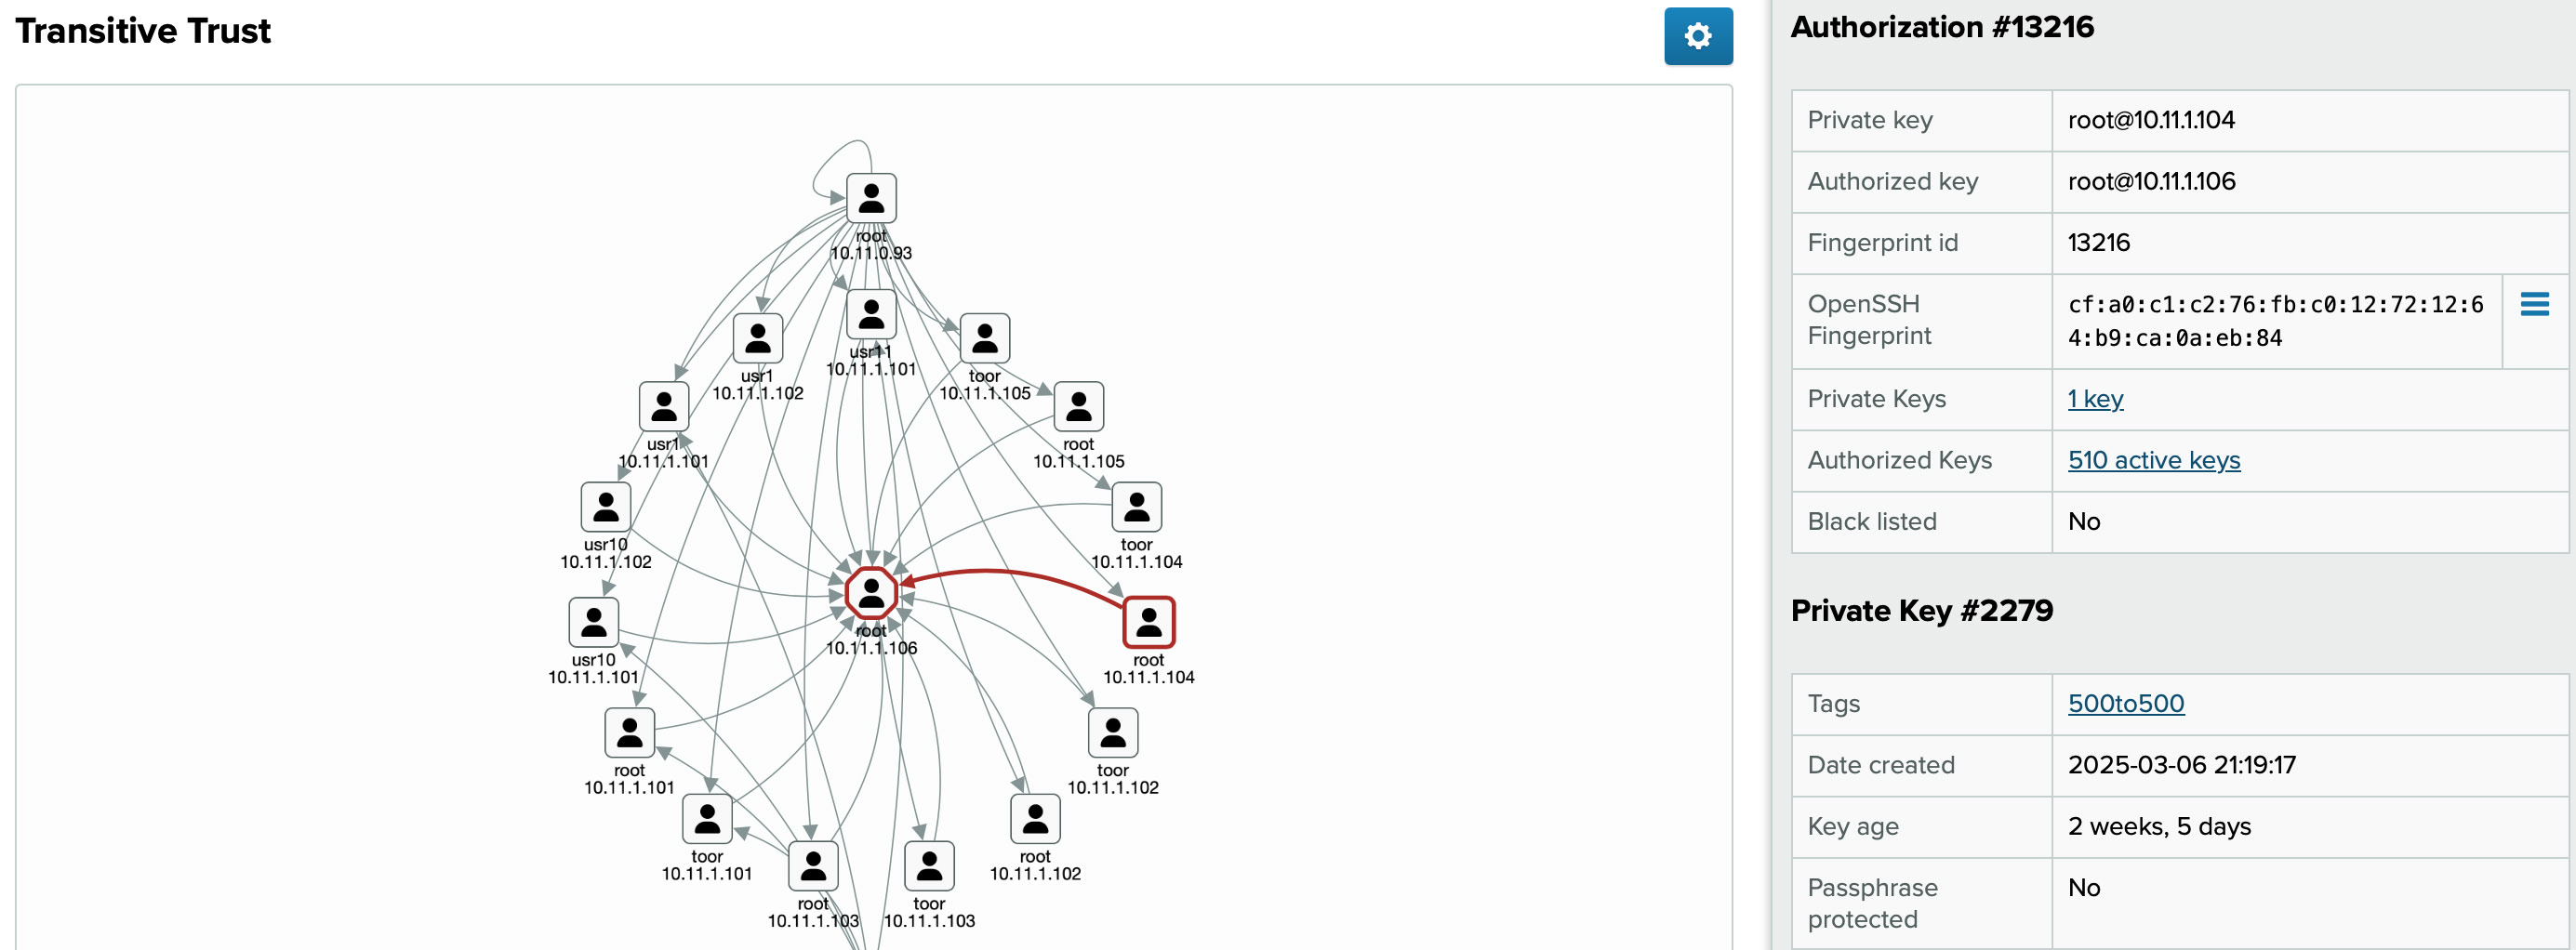
Figure 9.3. Example graph visualizing access to and from a user
To navigate the graph: Click and drag to move around the graph. Scroll to zoom the graph.
Within the graph, you can click a user to get more information about them, and to highlight any authorizations to/from the user. Double-clicking a user re-centers the graph on them.
You can click an authorization (arrows between users) to display its details, including the keys that make up the authorization.
For additional graph settings such as layout, highlighting and clustering, click ![]() above the graph.
above the graph.